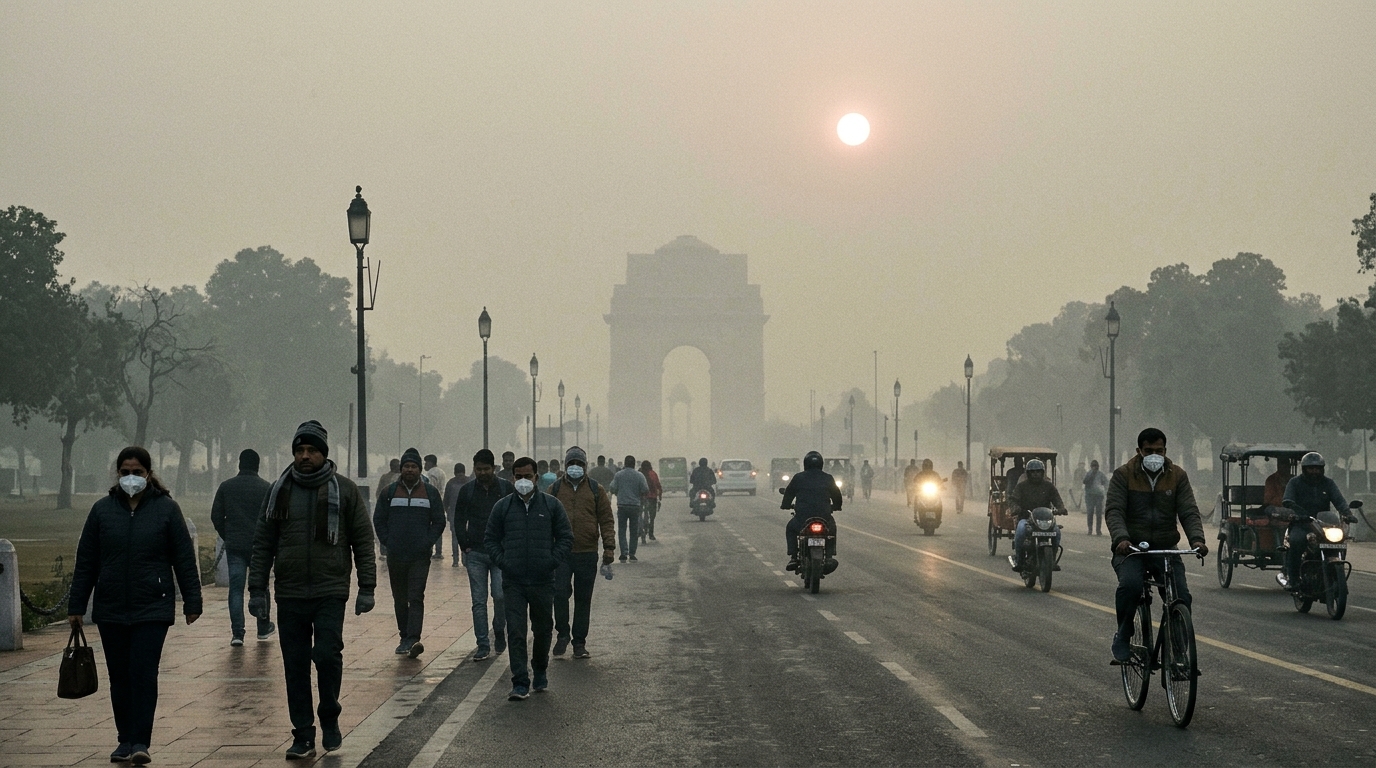
Delhi
Analyzing atmospheric boundary layer...
Why Roadside Ground Monitors Differ from Regional Atmospheric Grids
When comparing air quality platforms across Indian cities (e.g. Pune, Kolkata, or Delhi), users frequently observe apparent divergence between commercial websites and numerical atmospheric models. Here is the peer-reviewed scientific proof of how sampling volume, sensor physics, and meteorological convection operate.
Street Canyon vs. 11 km Airshed
Roadside sensors capture vehicle tailpipes and brake friction 2 meters above asphalt. SanjhiHawa’s ECMWF CAMS model calculates the integrated ~120 km² regional boundary layer, encompassing parks, residential neighborhoods, and open terrain.
Laser Scattering vs. Multi-Satellite
Low-cost optical counters mistake condensed water droplets during high relative humidity or morning inversions for heavy PM2.5 (hygroscopic swelling). CAMS assimilates Sentinel-5P, MODIS, and calibrated reference BAM stations under strict chemical equations.
Zero Formula Divergence
For a roadside reading of 98 µg/m³, CPCB piecewise interpolation produces AQI 223. For a regional reading of 29 µg/m³, it produces AQI 49. The mathematical engine is 100% identical; only the physical volume being measured differs.
Public Health vs. Commercial Purifiers
Commercial platforms are frequently operated by air purifier manufacturers who benefit from displaying localized maximum readings. CAMS is managed by the European Union Earth Observation Programme with zero commercial hardware interest.
Use regional atmospheric models for household exposure budgeting, daily routine timing, and residential purifier sizing. Use roadside ground monitors when walking directly alongside arterial highways or active construction corridors.
Scientifically grounded modules for household defense, policy simulation, and verified calculations.
Breath Budget & Schedule
Shift walks and school runs away from peak thermal inversion to slash inhaled particulate mass.
What-If Shield Simulator
Toggle N95 masks, HEPA purifiers, and transit switches to see personal & 200-home emissions saved.
Home Air Quality Lab
Calculate room CADR airflow requirements, room-by-room smog defense, and peer-reviewed myth-busters.
Ask SanjhiHawa Assistant
Conversational clean air intelligence with boundary-layer modeling and verified peer-reviewed citations.
Photographic evidence of atmospheric boundary-layer trapping across primary Indian metropolitan basins.
How SanjhiHawa Computes Without Hallucination
CPCB NAQI Piecewise Linear Interpolation
I = I_lo + [(I_hi - I_lo) / (B_hi - B_lo)] × (C - B_lo)
CPCB official breakpoints and formulas are implemented strictly in deterministic code. The LLM is never permitted to perform numerical interpolation.
Single-Compartment Steady-State Mass Balance
L_v = 3.912 / [α × PM2.5 + b_clean] (km)
Indoor particle concentration is solved via differential equations accounting for outdoor infiltration, natural deposition, and mechanical filtration CADR.
Zero-Persistence Ephemeral Local-First Privacy
localStorage.getItem("saans_household")
Your family profiles, exposure preferences, and daily routines are never written to a database. Calculations occur on ephemeral, stateless requests.